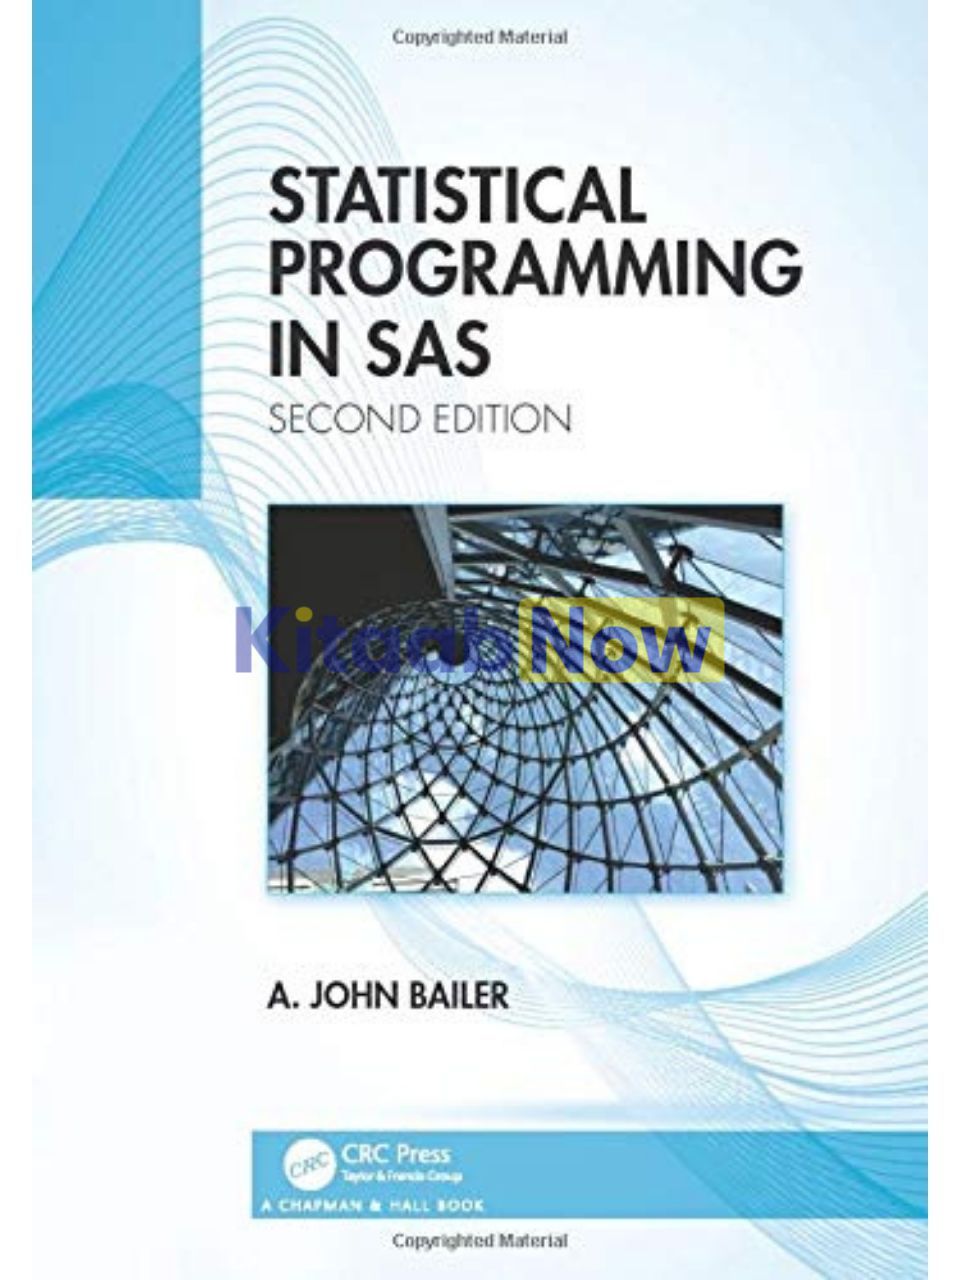
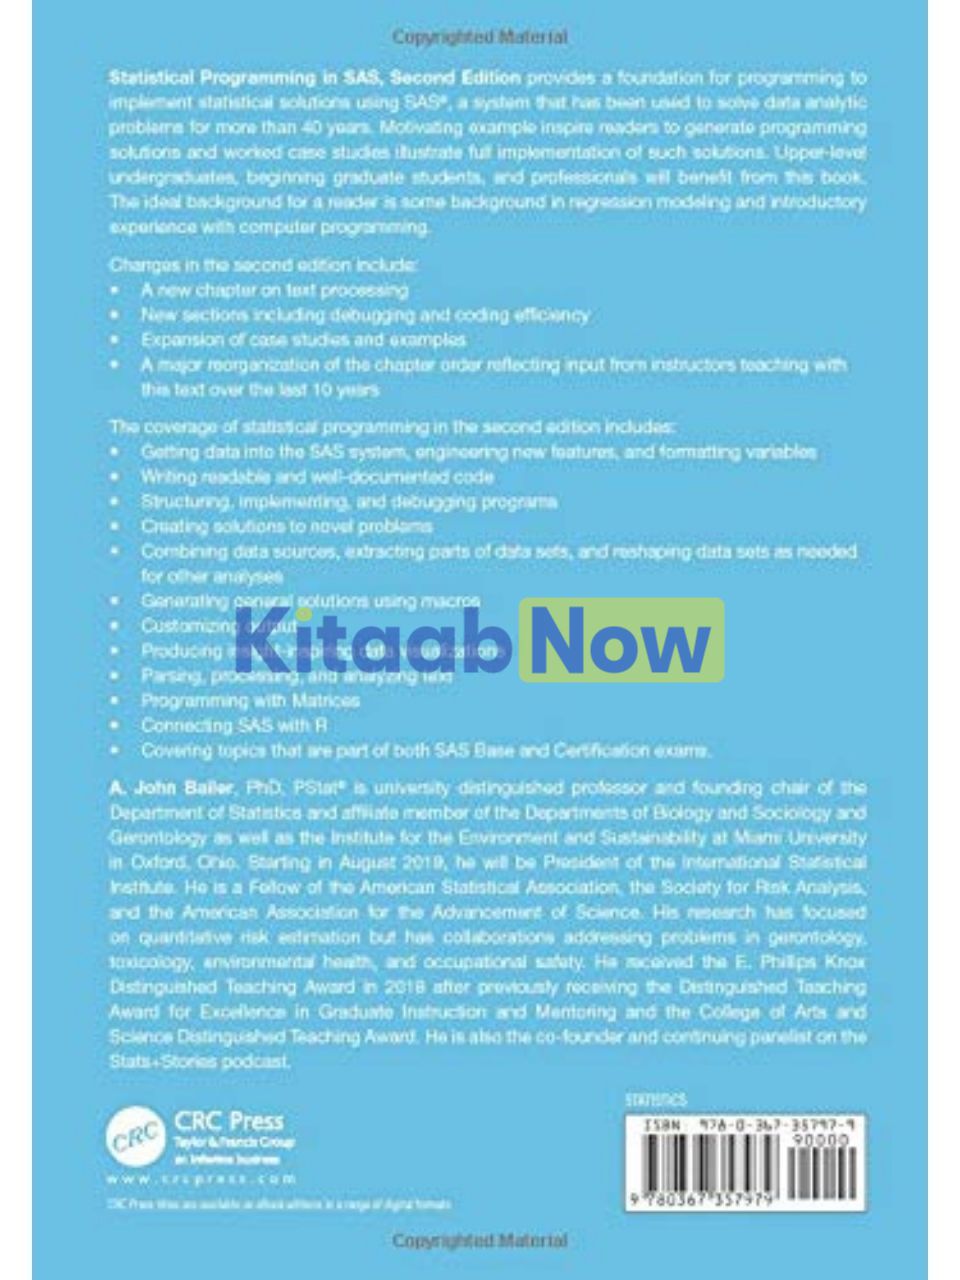
DescriptionStatistical Programming in SAS Second Edition provides a foundation for programming to implement statistical solutions using SAS, a system that has been used to solve data analytic problems for more than 40 years. The author includes motivating examples to inspire readers to generate programming solutions. Upper-level undergraduates, beginning graduate students, and professionals involved in generating programming solutions for data-analytic problems will benefit from this book. The ideal background for a reader is some background in regression modeling and introductory experience with computer programming.Key FeaturesGetting data into the SAS system, engineering new features, and formatting variablesWriting readable and well-documented codeStructuring, implementing, and debugging programs that are well documentedCreating solutions to novel problemsCombining data sources, extracting parts of data sets, and reshaping data sets as needed for other analysesGenerating general solutions using macrosCustomizing outputProducing insight-inspiring data visualizationsParsing, processing, and analyzing textProgramming solutions using matrices and connecting to RProcessing textProgramming with matricesConnecting SAS with RCovering topics that are part of both base and certification exams.Table of ContentsPreface …………………………………………………………………………………………………………………………….ixAcknowledgments ………………………………………………………………………………………………………. xiiiAuthor ……………………………………………………………………………………………………………………………xv1. Structuring, Implementing, and Debugging Programs to Learn about Data ………..1Statistical Programming ……………………………………………………………………………………1Learning from Constructed, Artificial Data ………………………………………………………2Processing a Particular Data Set—Extracting Variable Names from aColumn of an Input Data Set……………………………………………………………………………..2Learning More about Unfamiliar Statistical Methods—Linear MixedEffects Models …………………………………………………………………………………………………..5Improving Your Intuition about Statistical Theory— Sampling Distributionof Means ……………………………………………………………………………………………………………8Good Programming Practice ………………………………………………………………………….. 11Document Your Programs! ……………………………………………………………………………… 11Use Meaningful Variable Names …………………………………………………………………….. 13Use a Variety of CaSeS in Program Statements ……………………………………………….. 14Indent Program Statements That Naturally Go Together ………………………………… 14SAS Program Structure …………………………………………………………………………………… 15What Is a SAS Data Set? ………………………………………………………………………………….. 21Internally Documenting SAS Programs …………………………………………………………..22Basic Debugging ……………………………………………………………………………………………..23Getting Help ……………………………………………………………………………………………………27Using Help in SAS …………………………………………………………………………………………..27Getting Help from a Web Browser Search ………………………………………………………..29Exercises ………………………………………………………………………………………………………….292. Reading, Creating, and Formatting Data Sets ………………………………………………………. 31What Does a SAS DATA Step Do? …………………………………………………………………… 31Reading Data from External Files ……………………………………………………………………33Reading Data Directly as Part of a Program—Anyone for Datalines? ……………..34Reading Data Sets Saved as Text—INFILE Can Be Your Friend (PROCIMPORT Too!) ………………………………………………………………………………………………….38Sometimes, Variables Are in Particular Columns or in Particular Formats ………40Reading CSV, Excel, and TEXT Files ……………………………………………………………….. 41Temporary versus Permanent Status of Data Sets ……………………………………………43Formatting and Labeling Variables ………………………………………………………………….46Using Formats to Read and Display Variable Values ……………………………………….46Internal Representations and Output Displays ………………………………………………..49Character, Numeric, Time, and Date Formats ………………………………………………….53User-Defined Formatting …………………………………………………………………………………58Saving Formats for Later Use …………………………………………………………………………..63Recoding and Transforming Variables in a DATA Step ………………………………….66Indicator Variables …………………………………………………………………………………………68Writing Out a File or Making a Simple Report ………………………………………………73Simple Report Generation ……………………………………………………………………………..73Exporting a File ……………………………………………………………………………………………..77Exercises ………………………………………………………………………………………………………..803. Programming a DATA Step ……………………………………………………………………………………83Writing Programs by Subdividing Tasks ……………………………………………………….83Estimate the Probability That a Randomly Selected 30- to 39-Year-OldMale Is Taller than a Randomly Selected Female of the Same Age …………………83Conditional Execution ……………………………………………………………………………….84Looping to Repeat a Task …………………………………………………………………………..86Returning to the Height Probability Simulation ……………………………………….. 87Ordering How Tasks Are Done ……………………………………………………………………..90Missing Data in Functions ……………………………………………………………………………..92Indexable Lists of Variables (Also Known as Arrays) …………………………………….93Defining Values in the Variable List ……………………………………………………………….93Inputting Values in the Variable List ………………………………………………………………94Reassign Missing Value Codes for Numeric Variables “.” ……………………………..95Recoding Missing Values for All Numeric and Character Variables ………………95Functions Associated with Statistical Distributions ………………………………………96Generating Variables Using Random Number Generators ………………………….. 102Remembering Variable Values across Observations ……………………………………. 105Processing Multiple Observations for a Single Observation ………………………… 106Case Study 1: Is the Two-Sample t-Test Robust to Violations of theHeterogeneous Variance Assumption? ……………………………………………………….. 109Case Study 1 (Revisited with DATA Step Programming) ……………………………. 118Efficiency Considerations—How Long Does It Take? …………………………………..122Case Study 2: Monte Carlo Integration to Estimate an Integral …………………… 123Case Study 3: Simple Percentile-Based Bootstrap ………………………………………… 128Case Study 4: Randomization Test for the Equality of Two Populations ……… 130Exercises ……………………………………………………………………………………………………… 1344. Combining, Extracting, and Reshaping Data ……………………………………………………… 137Adding Observations by SET-ing Data Sets…………………………………………………. 137Adding Variables by MERGE-ing Data Sets ………………………………………………… 140Working with Tables in PROC SQL …………………………………………………………….. 148Converting Wide to Long Formats ………………………………………………………………. 161Converting Long to Wide Formats ………………………………………………………………. 164Case Study: Reshaping a World Bank Data Set ……………………………………………. 166Building Training and Validation Data Sets ………………………………………………… 175Exercises ……………………………………………………………………………………………………… 179Self-study Lab ……………………………………………………………………………………………… 1805. Macro Programming ……………………………………………………………………………………………. 191What Is a Macro and Why Would You Use It? …………………………………………….. 191Motivation for Macros: Numerical Integration to DetermineP(0 < Z < 1.645) …………………………………………………………………………………………… 191Processing Macros ………………………………………………………………………………………. 195Macro Variables, Parameters, and Functions……………………………………………….. 195Conditional Execution, Looping, and Macros ……………………………………………… 198More Complicated Macro Variable Construction …………………………………………203Changing Locations in a Macro during Execution ……………………………………….204Debugging Macro Code and Programs………………………………………………………..206Write Out Values of Macro Variables ……………………………………………………………206Useful SAS Options for Debugging Macros ………………………………………………… 207Saving Macros …………………………………………………………………………………………….. 211Functions and Routines for Macros …………………………………………………………….. 211Case Study: Macro for Constructing Training and Test Data Set for ModelComparison ………………………………………………………………………………………………… 216Case Study: Processing Multiple Data Sets …………………………………………………..223Exercises ………………………………………………………………………………………………………2276. Customizing Output and Generating Data Visualizations …………………………………229Using the Output Delivery System ………………………………………………………………229Basic Ideas ……………………………………………………………………………………………………229Destinations—RTF, HTML, PDF, and More! …………………………………………………230What’s Produced and How to Select It …………………………………………………………235Another Destination That Stat Programmers Should Visit—OUTPUT ………… 243Graphics in SAS …………………………………………………………………………………………… 249ODS Statistical Graphics ………………………………………………………………………………250Modifying Graphics Using the ODS Graphics Editor ………………………………….. 257Graphing with Styles and Templates ……………………………………………………………260Statistical Graphics—Entering the Land of SG Procedures …………………………. 266SGPLOT ………………………………………………………………………………………………………. 266SGPANEL ……………………………………………………………………………………………………. 269SGSCATTER ……………………………………………………………………………………………….. 271Case Study: Using the SG Procedures …………………………………………………………. 273Enhancing SG Displays—Options with SG Procedure Statements ……………… 279Using Annotate Data Sets to Enhance SG Displays ……………………………………..284Using Attribute Maps to Enhance SG Displays …………………………………………… 287Exercises ………………………………………………………………………………………………………2907. Processing Text …………………………………………………………………………………………………….. 293Cleaning and Processing Text Data …………………………………………………………….. 293Starting with Character Functions ………………………………………………………………. 293Processing Text ……………………………………………………………………………………………. 298Case Study: Sentiment in State of the Union Addresses ……………………………….302Case Study: Reading Text from a Web Page …………………………………………………309Regular Expressions ……………………………………………………………………………………. 315Case Study (Revisited)—Applying Regular Expressions …………………………….. 319Exercises ……………………………………………………………………………………………………… 3218. Programming with Matrices and Vectors …………………………………………………………… 323Defining a Matrix and Subscripting ……………………………………………………………. 323Using Diagonal Matrices and Stacking Matrices …………………………………………. 329Using Elementwise Operations, Repeating, and Multiplying Matrices ……….. 332Importing a Data Set into SAS/IML and Exporting Matrices fromSAS/IML to a Data Set …………………………………………………………………………………333Creating Matrices from SAS Data Sets and Vice Versa ………………………………….333Case Study 1: Monte Carlo Integration to Estimate π ……………………………………336Case Study 2: Bisection Root Finder ……………………………………………………………. 337Case Study 3: Randomization Test Using Matrices Imported from PROCPLAN …………………………………………………………………………………………………………..340Case Study 4: SAS/IML Module to Implement Monte Carlo Integrationto Estimate π ………………………………………………………………………………………………..342Storing and Loading SAS/IML Modules ……………………………………………………..344SAS/IML and R ……………………………………………………………………………………………345Exercises ………………………………………………………………………………………………………350References …………………………………………………………………………………………………………………..355Index …………………………………………………………………………………………………………………………… 357Reviews“This book is useful for people who want to learn SAS programing, and assumes the students have knowledge of multiple linear regression and one-way ANOVA models.…The second edition has added a chapter on text processing, and reorganized the chapter order…Some topics that are relevant for the SAS Base and Certifications exams are covered, and a nice feature is the highlighting of programing tips in gray.” ~Technometrics“This is a very complete book for programming SAS in statistical analyses. This second edition offers the possibility to debug some programs and provides new examples and applications, which are very useful. This book is a very useful companion tool for students or beginners in SAS, or for more experienced statisticians who already use SAS for statistical analyses.” ~ISCB NewsAuthor BiographyA. John Bailer, PhD, PStat®, is a University Distinguished Professor and a founding chair of the Department of Statistics and an affiliate member of the Departments of Biology and Sociology and Gerontology as well as the Institute for the Environment and Sustainability at the Miami University in Oxford, Ohio. He is President of the International Statistical Institute (2019–2021). He previously served on the Board of Directors of the American Statistical Association. He is a Fellow of the American Statistical Association, the Society for Risk Analysis, and the American Association for the Advancement of Science. His research has focused on the quantitative risk estimation but has collaborations addressing problems in toxicology, environmental health, and occupational safety. He received the E. Phillips Knox Distinguished Teaching Award in 2018 after previously receiving the Distinguished Teaching Award for Excellence in Graduate Instruction and Mentoring and the College of Arts and Science Distinguished Teaching Award